Nikolay Golosov
GIS Programming - GeoTREE LiDAR Data downloader
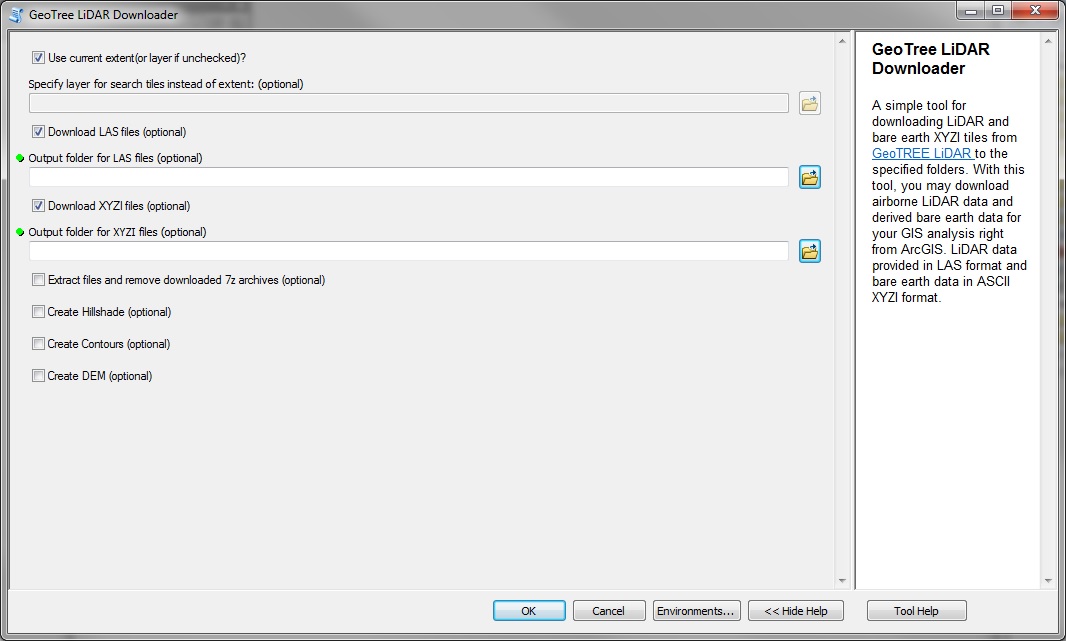
Iowa, as most US states have publically available LiDAR coverage. GeoTree Center, University of Northern Iowa provides access to LiDAR data via a web-GIS. I developed the ArcGIS toolbox to facilitate downloading LiDAR data from a GeoTree web server right from ArcGIS Desktop without using a web-GIS interface. Users can select areas of interest, download LIDAR tiles, bare earth XYZI files and create derived products, such as DEM, Hillshade and Contours datasets. The tool provides the user with a choice to download the LiDAR tiles that fall to the current ArcGIS map extent or the extent of the selected layer. As the user doesn't have to choose areas of interest manually using the web-GIS interface, the tool eliminates manual work, minimizes chances to download wrong tiles and improves user' experience and productivity.
GIS2 - Dasymetric mapping of Iowa City, IA population
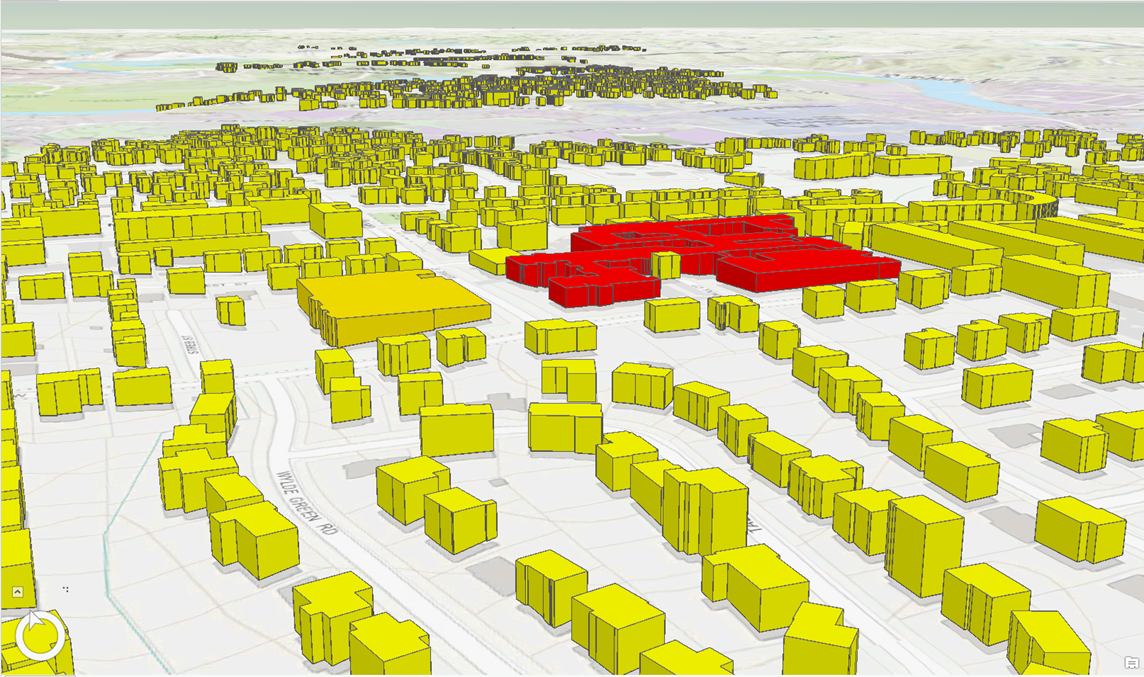
A population is usually estimated by sizeable census tracts/blocks covering significant areas. Such measures are protecting privacy, but not giving a precise spatial representation of population distribution. My goal was to accurately depict population distribution for the study area using the dasymetric mapping, to show the actual population distribution on the buildings level.
In my term project, I developed a workflow in Safe Software FME allowing quick creation of dasymetric maps using the 3D volumetric method of dasymetric mapping and tested the workflow in Iowa City area, IA. As the outcome of the project, I created static and web maps, showing population density and population counts at a building level.
GPS - Evaluation of the applicability of the medium-wave infrared range for the estimation of heat losses for City of Cedar Falls, IA
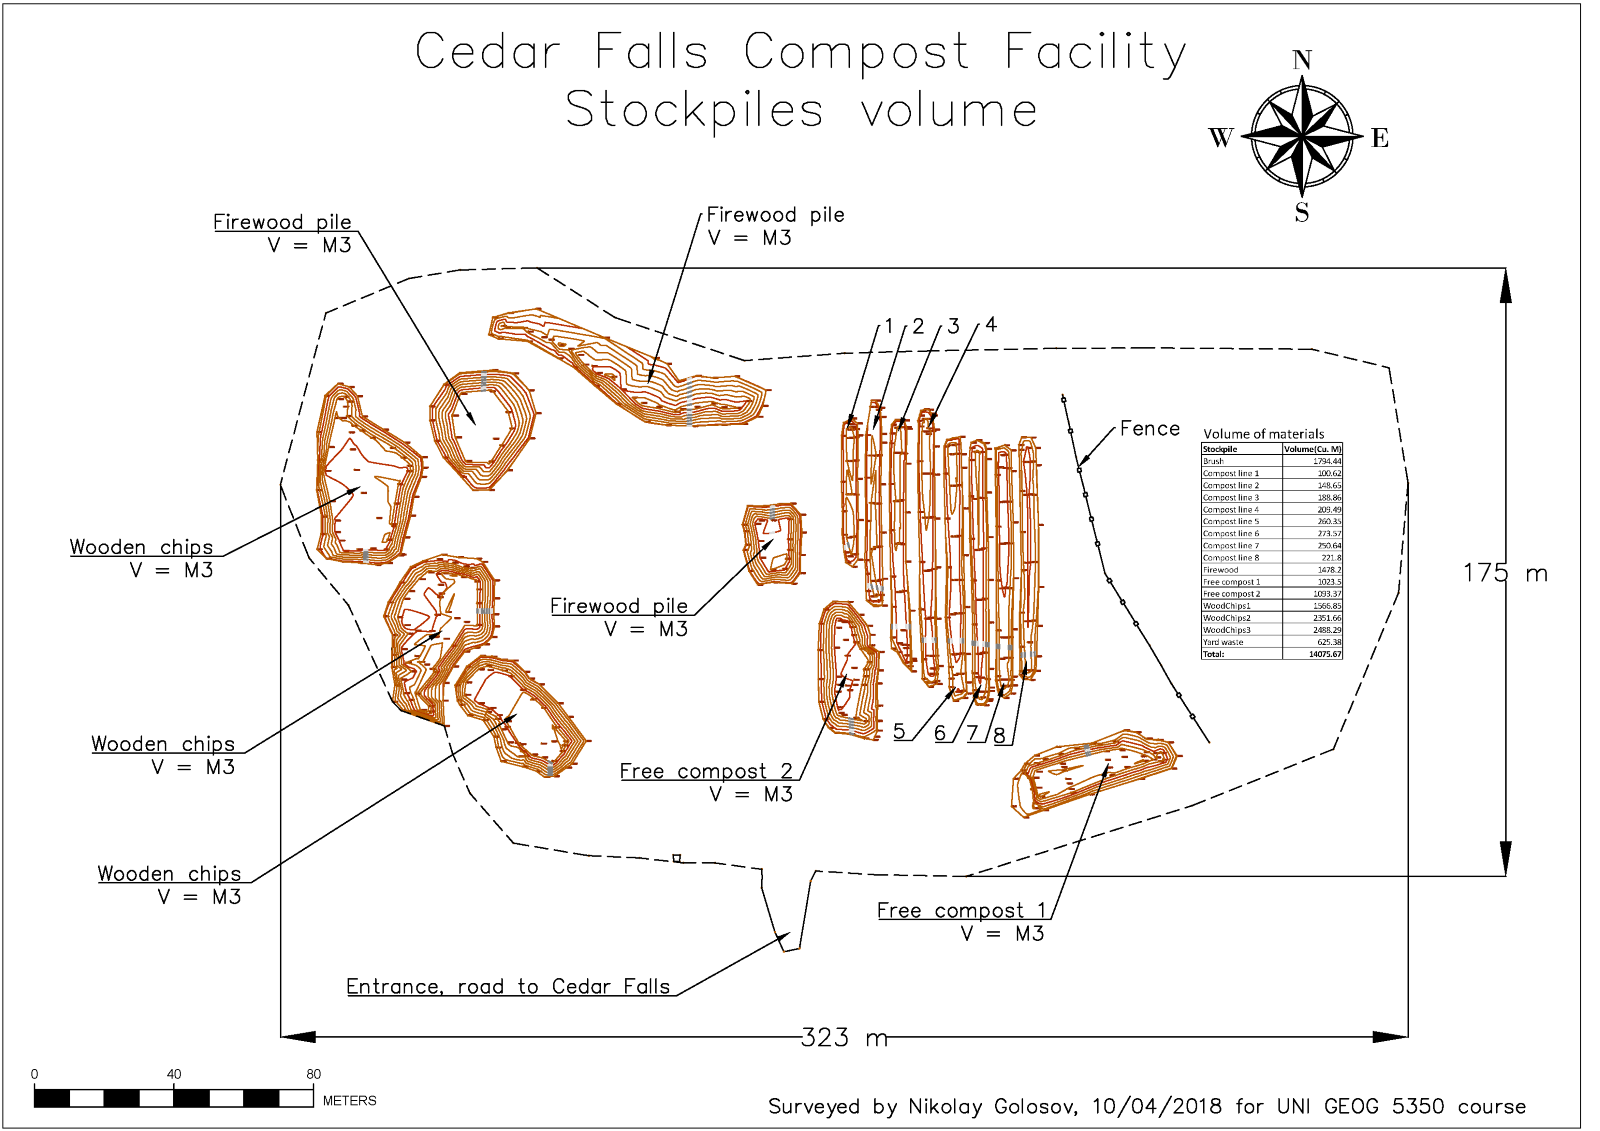
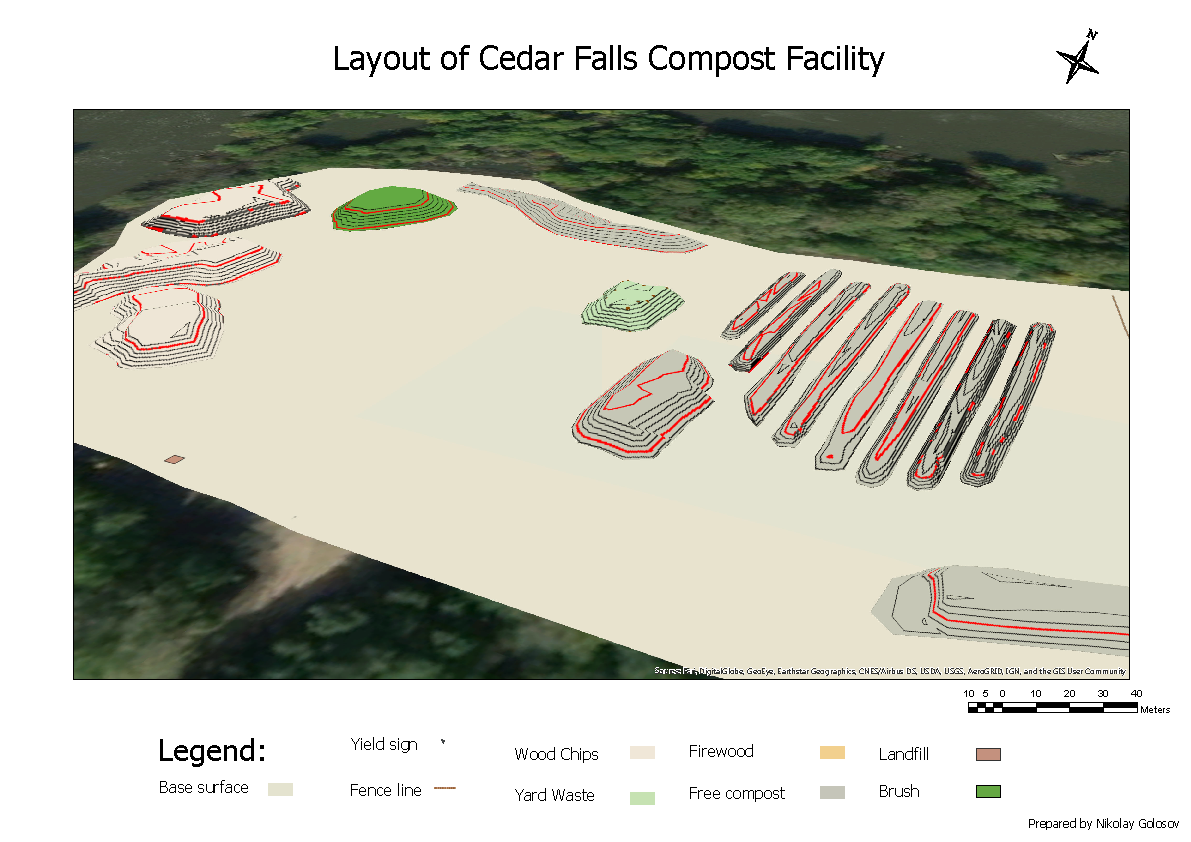
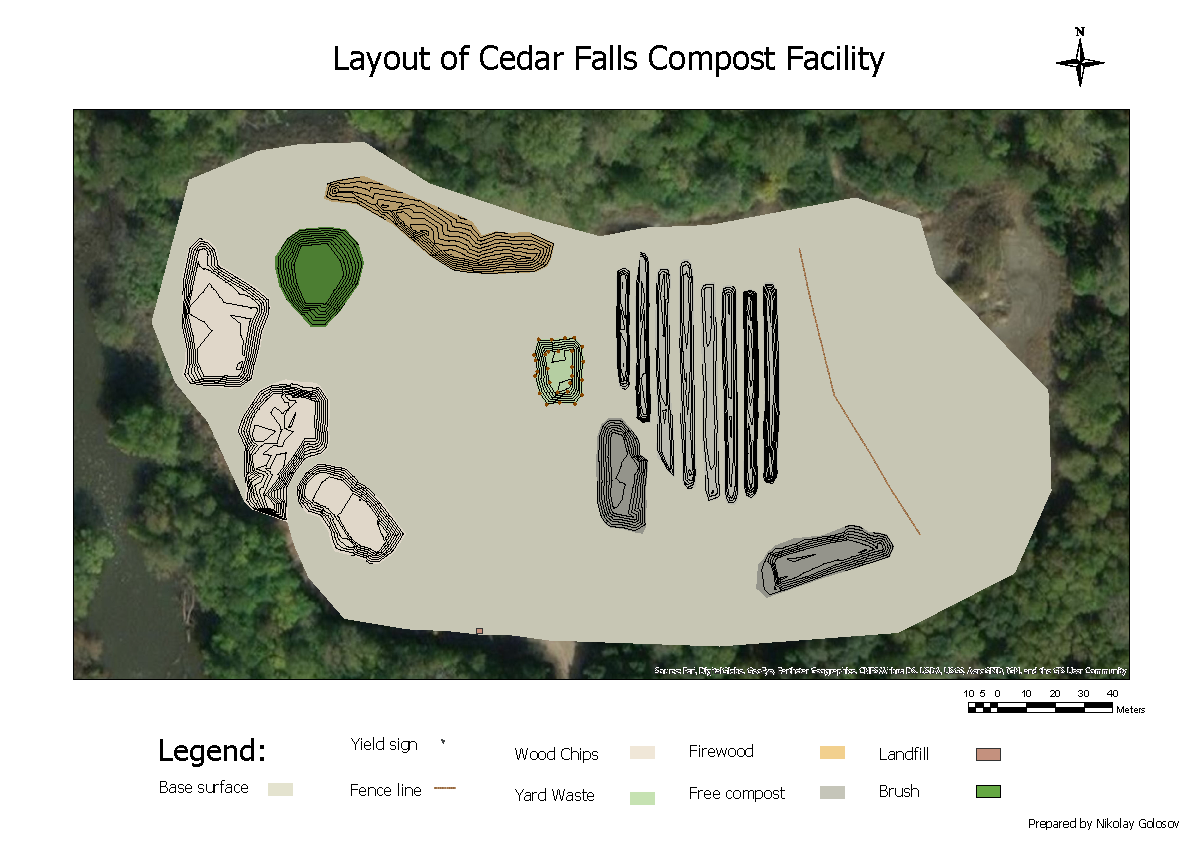
In this project, I evaluated the capabilities of a professional GPS receiver to measure the volume of the bulk solid materials accurately. During the field work, I performed volume measurements of the stockpiles at the Cedar Falls Compost Facility using Trimble survey-grade GPS in RTK mode. As an outcome of the project, a set of drawings were created depicting the layout of stockpiles and an assessment of their volumes.Screenshots (click to enlarge):
Panoramic tours for UKAN Project, Uzbekistan
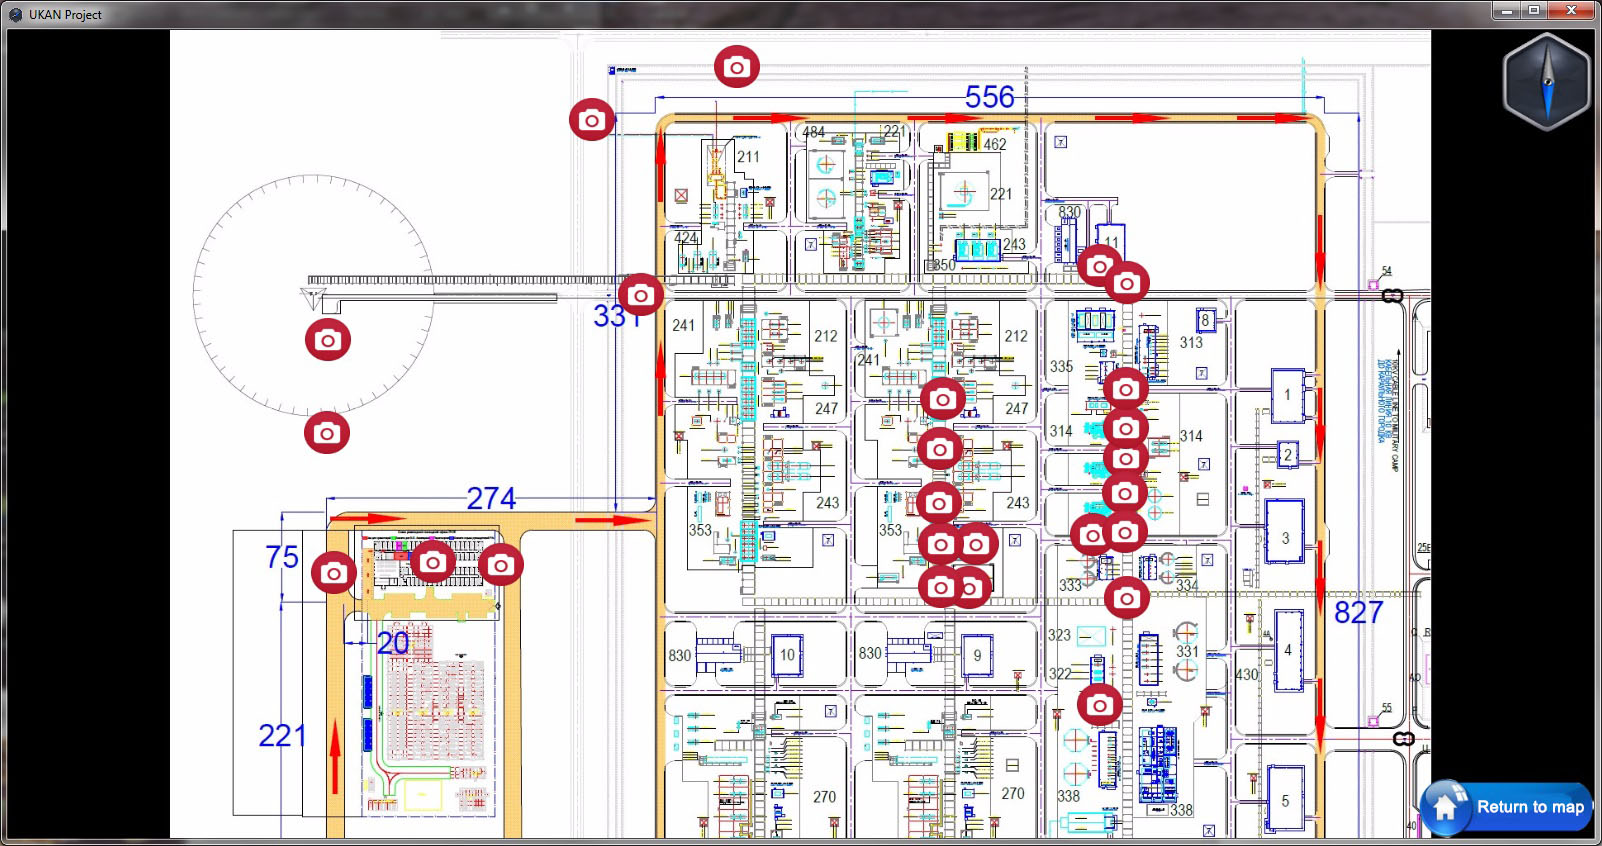
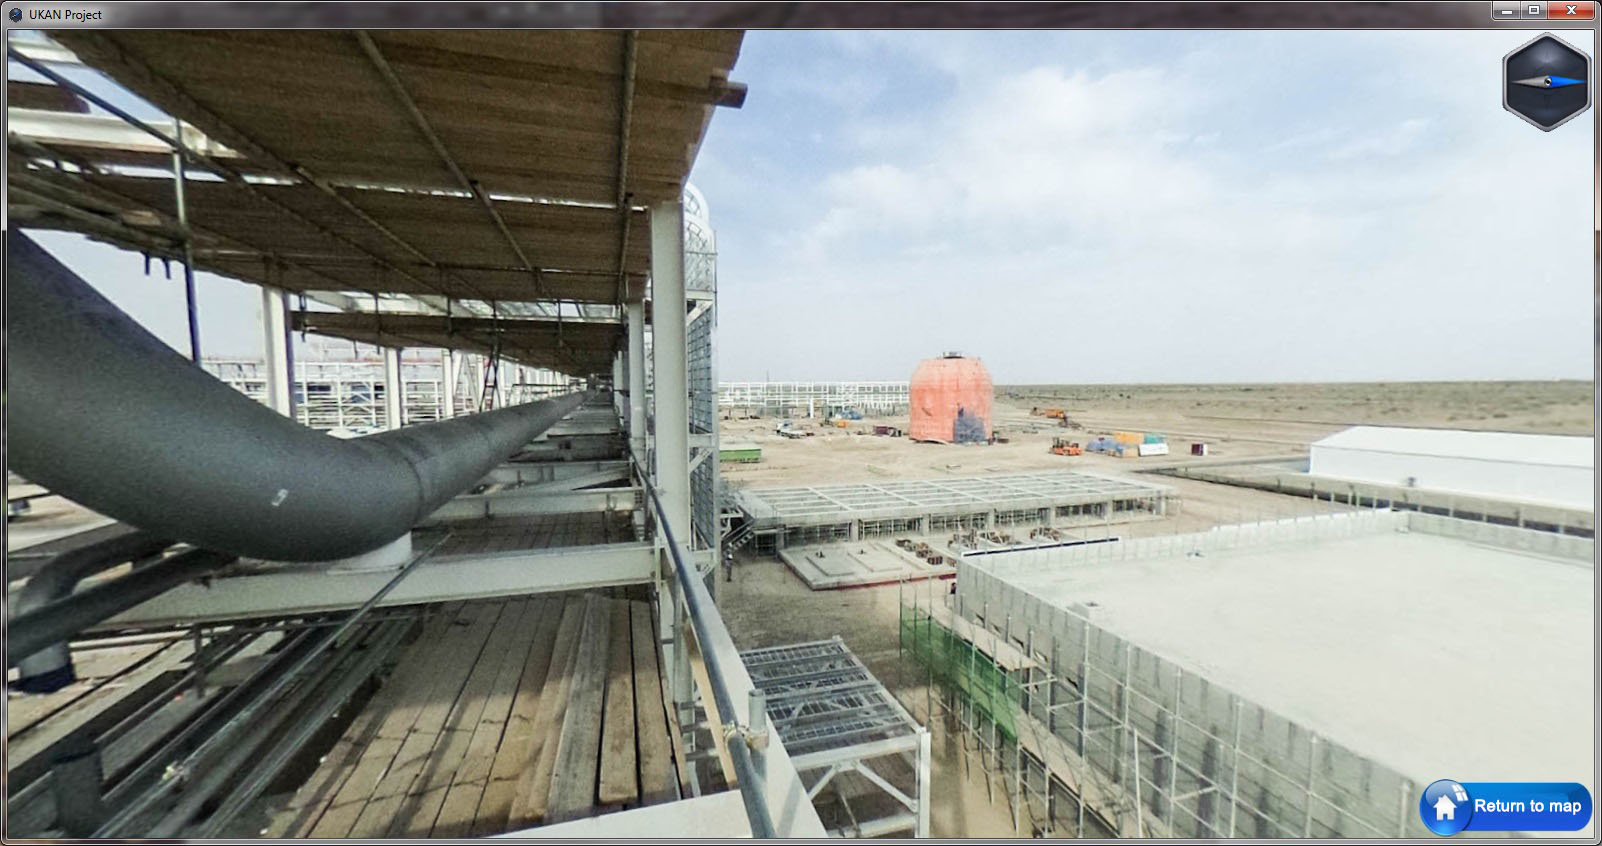
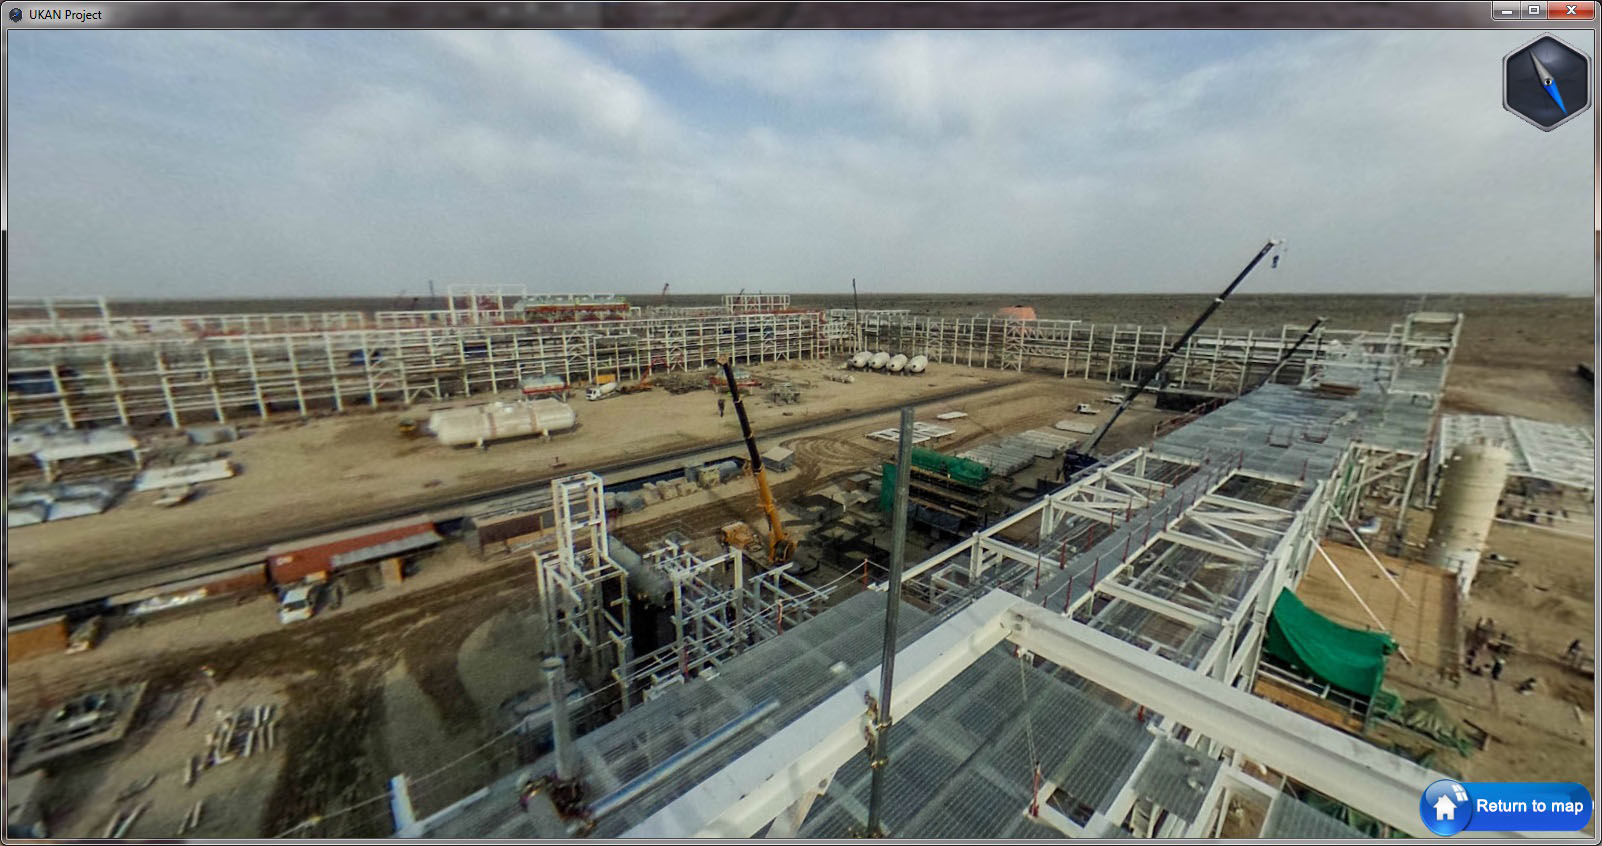
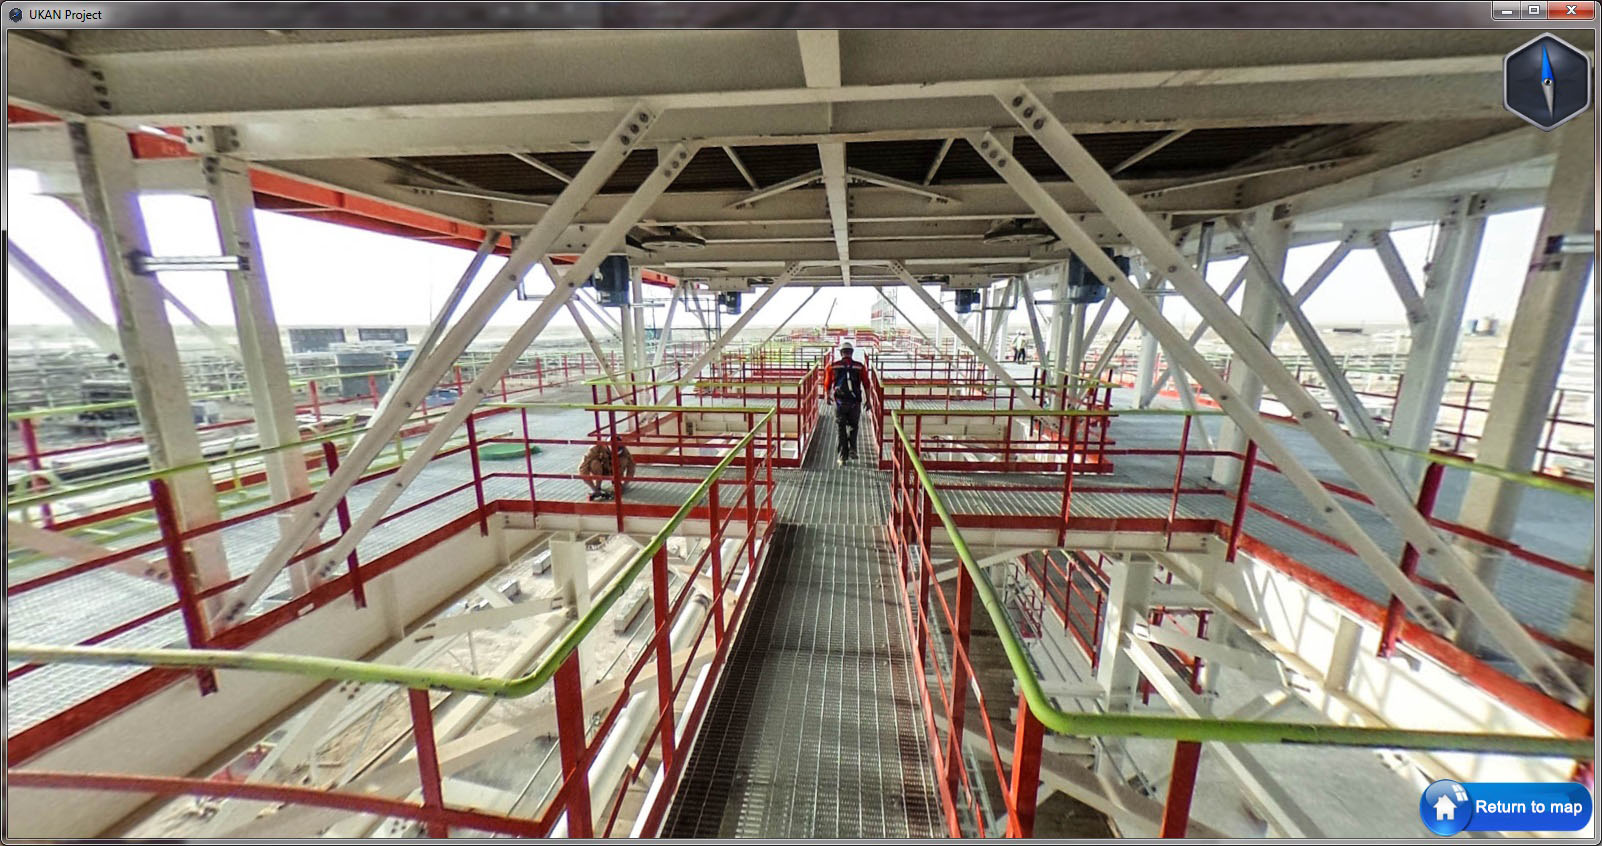
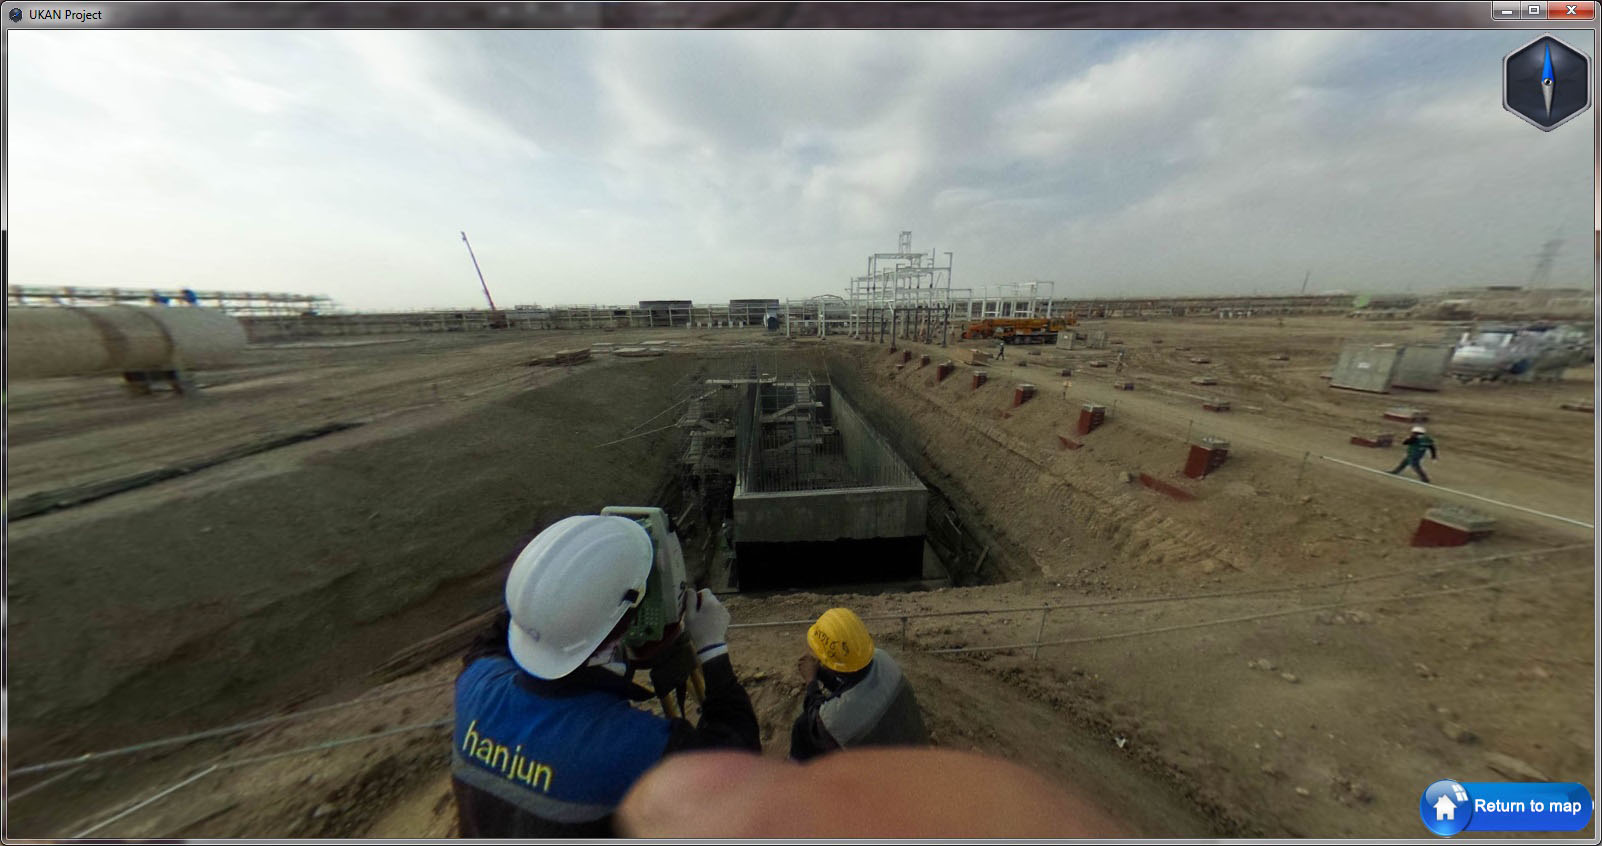
During this project, I created panoramic tours of the construction site of the gas processing plant at the Kandym gas field(Bukhara, Uzbekistan) to improve construction progress reporting. My role was to acquire the panoramic images at the construction site and create an easy-to-use viewer, where users can view the panoramic images, displayed at the site map. The viewer was implemented using the KRPano Viewer, customized using Javascript API, and embedded into a portable desktop application using NW.js framework. Having completed field data collection, I pinpointed the locations of the panoramic images from their EXIF coordinates onto a site map. Then I produced the panoramic tours and distributed them among the end users via a local network and flash drives(for the remote locations without access to the local intranet).Screenshots (click to enlarge) :
RS1 - Evaluation of supervised classification algorithms accuracy on Sentinel 2 data on Adair and Delaware Counties, Iowa
The goal of my course project was to assess the accuracy of the classification of Land Use Land Cover types of the Sentinel 2 satellite data using various classification algorithms, such as the Artificial Neural Network, Maximum Likelihood, Support Vector Machine, and Random Forest algorithms. As part of the project, I downloaded Sentinel 2 scenes to the territory of interest, performed automatic geometric correction using NAIP imagery, training classification algorithms, performed classification and accuracy assessment using Harris ENVI 5.5 software.The best-performing methods in terms of overall accuracy for supervised of Land use/Land cover classification of Sentinel-2 imagery for rural US areas were Artificial Neural Network, Maximum Likelihood, Support Vector Machine, and Random Forest algorithms. Regarding processing time, the fastest methods were Maximum Likelihood and Random forest algorithms, and the slowest - Support Vector machine.
When the training data derived from the geometrically corrected ground truth image, the classification algorithms demonstrated steady but negligible accuracy increase around 1%. It could indicate that additional geometric correction of L1C Sentinel-2 products in most cases does not worth the efforts.
Download the tool from the GeoTREE website:
TAMARA Project
TAMARA (Taimyr Reindeer Migration Reanalysis) is one of the main projects in which I am involved as a research assistant. The Extreme North Agricultural Research Institute in Norilsk, Russia carry out monitoring of the world’ largest wild reindeer herd since 1969. However, the institute stored the monitoring data as a hard copy in Russian. The reports were not digitized and processed using modern geospatial technologies. Also, the only limited amount of the data was published, so these works remained inaccessible to most scientists. The goal of the TAMARA project is to digitize the data contained in the reports, produce digital maps and derivative products, identify the herd migration patterns, disseminate the derived datasets and publish the analysis results. For this project, my goals were to develop a technique for semi-automatic digitization of spatial data from the scanned copies of the reports using Safe Software FME and Altova Mapforce. Then I digitized reports for the period of 1980-1991 (9 reports total) and created an estimation of reindeer counts on 25x25 km grid. Also, I shared the results at the NSF Arctic Datacenter website. Now I am working at the spatial analysis of patterns of migration of wild reindeer under the influence of natural factors.
Screenshots (click to enlarge) :
Poster presentation:
Presentation:
Project report:
Published datasets on the NSF ArcticDatacenter website:
Poster:
Screenshots (click to enlarge) :
Screenshots (click to enlarge) :
Link to a web map (ArcGIS Online):
Poster:
Sprinter Web-GIS
During this project, I developed a web application to manage 360-degree panoramic images of the West Qurna 2 oilfield located in Basrah, Iraq.
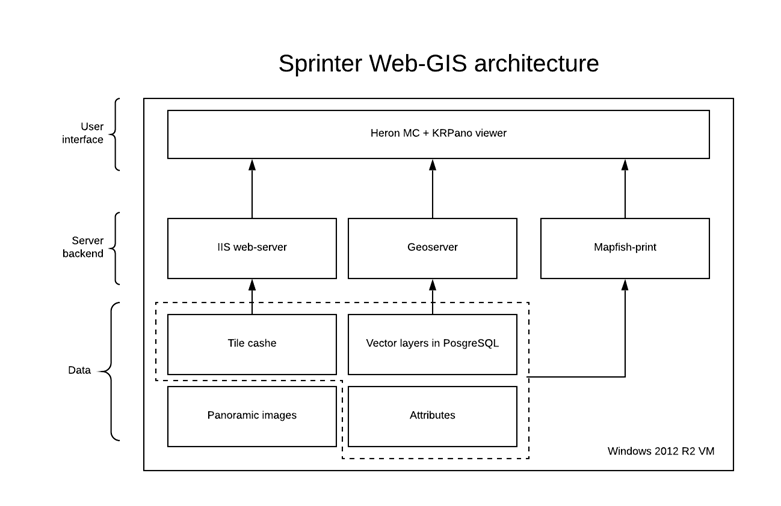
As part of the project, I developed the system’ web-interface, prepared and published the available spatial data. During the project implementation about 10,000 panoramic images were captured to cover the main roads of the oilfield using the panoramic camera mounted on the roof of a car. To develop user interface of the system, I mostly used various open-source tools such as HeronJS javascript framework (based on OpenLayers and ExtJS) and KRPano panoramic viewer. As a backend, I used GeoServer connected to a PostgreSQL database to store spatial data. In addition, I developed helper Python scripts to implement service functions such as coordinate conversion, map bookmarks creation and links shortening. Automation of panoramic image processing (linking panoramic spheres to each other, creating XML files with information about the relationships between images) was done using the FME Desktop software.
As a result, the web-GIS provided users with a convenient and fast web interface for viewing panoramic images. All panoramic images were automatically linked to each other to allow users to view and navigate between panoramic images in the same way as Google StreetView. Also, the system facilitated the searching and displaying various spatial information, such as an oilfield master plot plan and individual objects. Additionally, users could use measurements on a map and search by attributes.
Screenshots (click to enlarge) :
Portfolio
Resume
Portfolio
Certifications
Events
Contact
RS2 - Evaluation of the applicability of the medium-wave infrared range (MWIR) imagery for the estimation of heat losses for City of Cedar Falls, IA
As part of the project, I investigated the feasibility of using medium-wave (MWIR) infrared images to assess heat loss by buildings and structures.
The aim of the study was the processing and comparison of long-wave and medium wave temperature images of the City of Cedar Falls. At the initial step, I pre-processed the images by converting radiance to kinetic temperature using Plank Law inversion. Then the images were visually compared using a standard deviation classification in the ArcGIS and statistically, by running t-tests between the extracted temperature values from short wave and long-wave infrared imagery at the areas belonging to different materials. According to visual and statistical assessment, MWIR images are not performing as good as LWIR images in terms of the distinction between subtle thermal differences. According to the t-test, MWIR thermal image is showing better performance for temperature measurements of non-asphalt roofs. For asphalt and plywood roofs, the t-test results are showing no relationship between MWIR and LWIR bands.
Home
